One of the realities of running a software development business is that every decision has a compounding effect. A project that runs over budget, inconsistent timesheet recording, or too much effort being spent on internal work might not seem significant in isolation, but over time those small issues impact profitability, delivery capacity and ultimately the experience our clients receive.
Like many businesses, we had no shortage of data. Timesheets, projects, tickets, leave, invoices and staff allocations all existed within our systems. The challenge wasn't collecting information (that is actually a strength of having our own software); it was turning it into something that actually helped us make better decisions.
We found ourselves asking the same questions every week. Are we recording enough time? Is utilisation where it should be? Which teams are under pressure? Are people spending more time on internal initiatives than we expected? Are the changes we're making actually improving performance?
The answers were there, but they were spread across multiple reports and required someone to manually piece everything together before a management meeting. By the time we had the information, we were often looking backwards instead of being able to respond in real time.
So we built a better way.
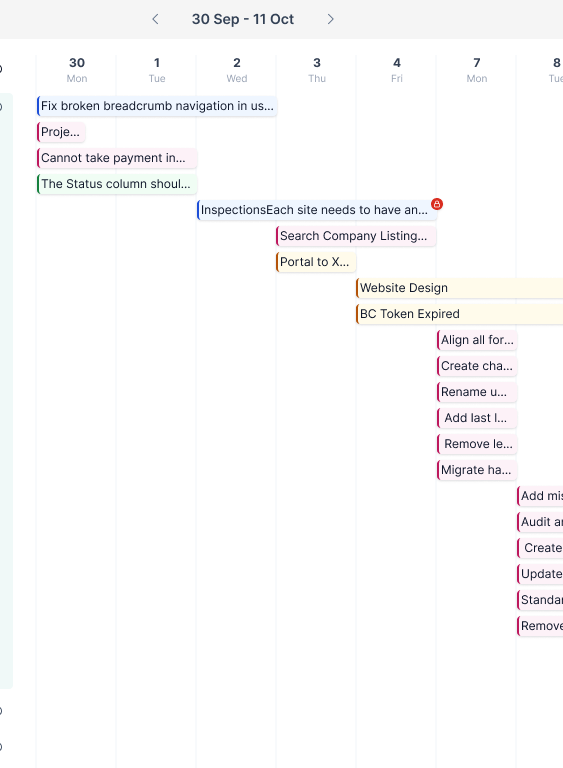
As part of Kanopi, the platform we use to run Dcode Group, we developed a Staff Productivity Dashboard that brings together timesheets, projects, billable work, leave and staff capacity into a single view. Rather than presenting management with pages of numbers, the dashboard focuses on a handful of measures that genuinely influence how we run the business.
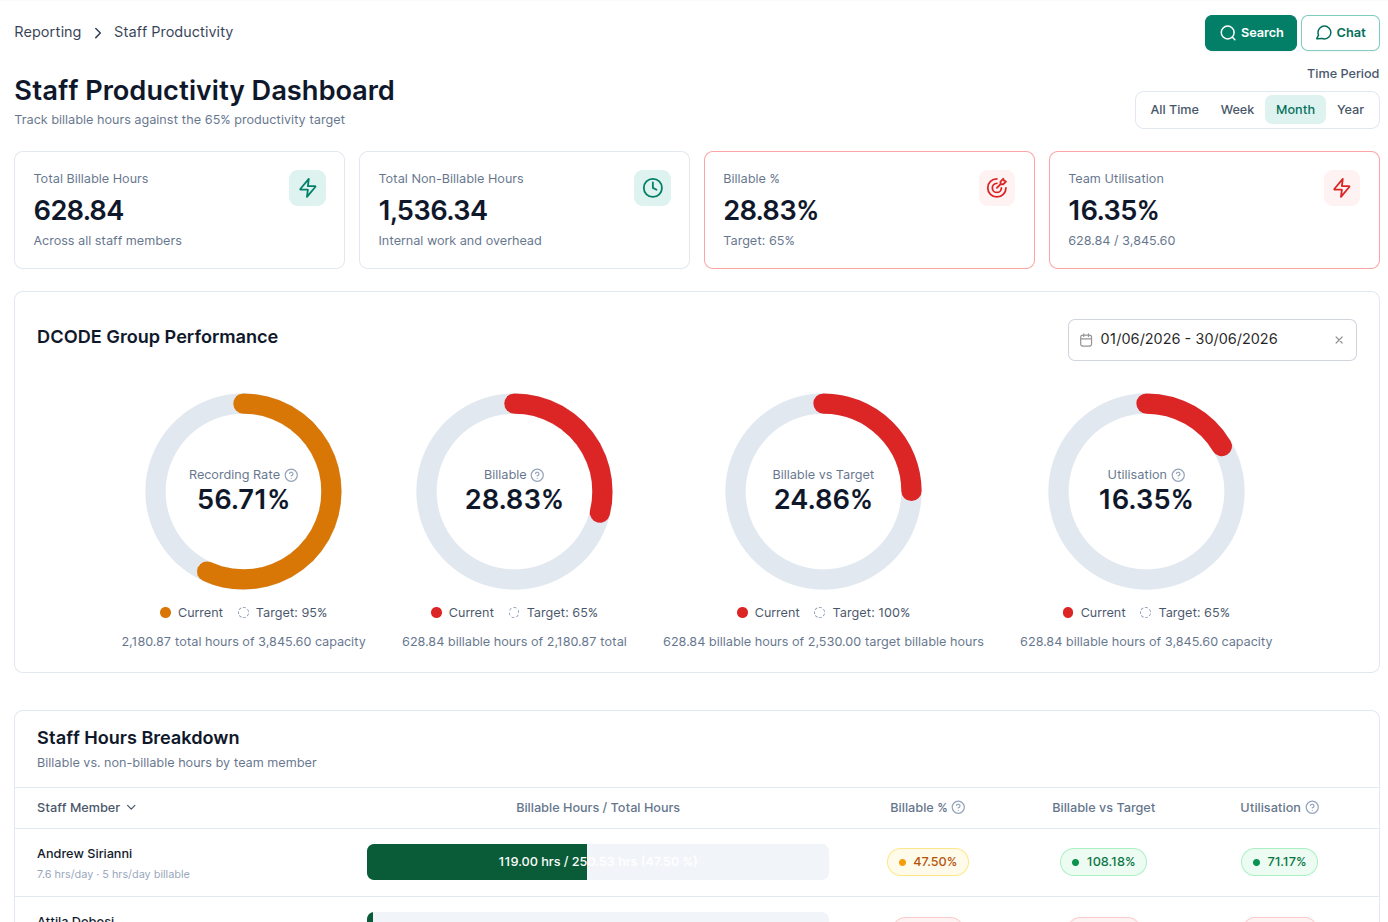
One of the most important metrics isn't billable utilisation at all. It's recording rate. If people aren't consistently recording their time, every other metric becomes less meaningful because you're making decisions using incomplete information. Improving recording rates has given us far greater confidence in the conversations we have around project performance and resource planning.
From there we can see how much recorded time is genuinely billable, how that compares to our internal targets, and how the business is performing against available capacity. Rather than waiting until the end of the month to understand where we stand, we can identify trends as they emerge and take action while there's still time to influence the outcome.
The dashboard also allows us to drill into individual team members, but not for the reasons many people assume. The goal isn't to monitor activity or micromanage developers. Context matters. Someone with lower billable hours may have spent the week mentoring junior staff, helping pre-sales, improving internal tooling or delivering strategic work that doesn't directly generate revenue. The dashboard starts the conversation; it doesn't replace it.
Perhaps the biggest benefit has been changing the way we talk about performance internally. Instead of debating opinions, we're discussing evidence. Rather than asking whether we think we're busy, we can see exactly how capacity is changing. Instead of wondering whether internal initiatives are affecting productivity, we can measure the impact over time. Better information leads to better conversations, and better conversations lead to better decisions.
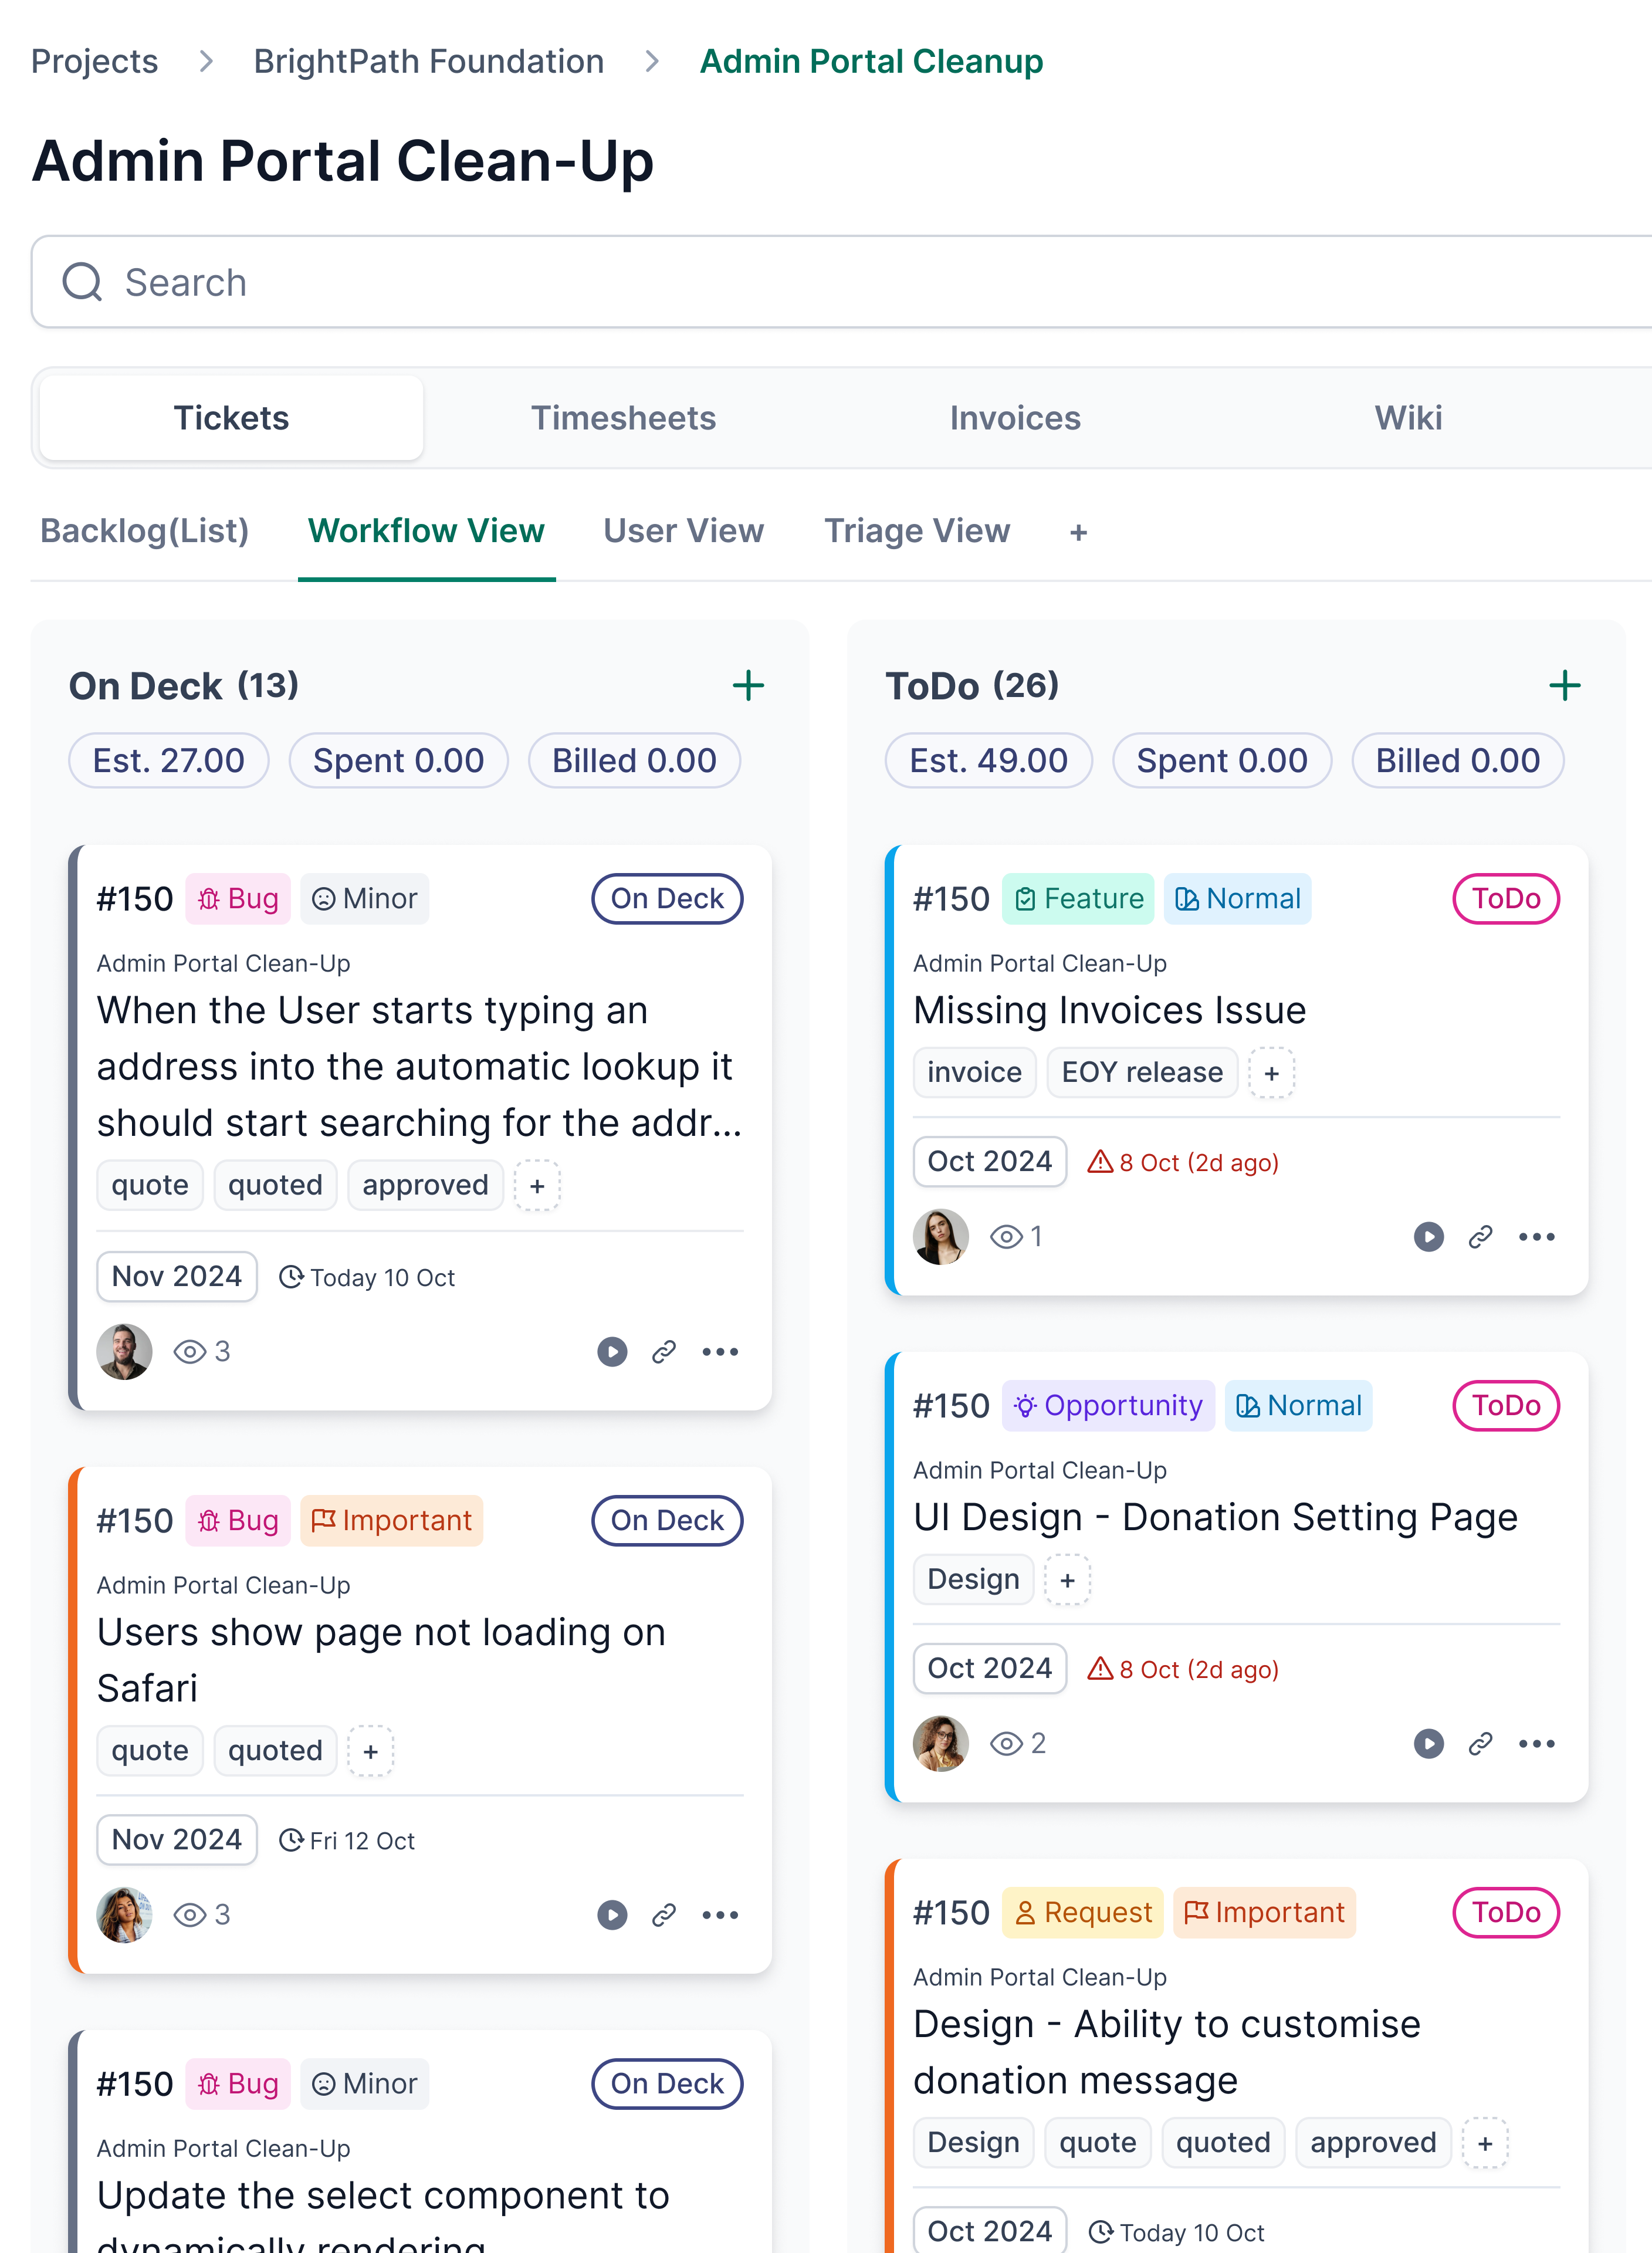
This dashboard wasn't built because a client asked for it. It exists because we wanted to run Dcode Group more effectively. Every day our own team relies on Kanopi to manage projects, support, timesheets, releases and reporting. In many ways, we're our own first customer. New features are typically born from challenges we've encountered ourselves before they become capabilities we can deliver to our clients.
For us, that's what custom software should do. It shouldn't simply replace spreadsheets or digitise existing processes. It should provide visibility, improve decision-making and help a business continuously refine the way it operates.